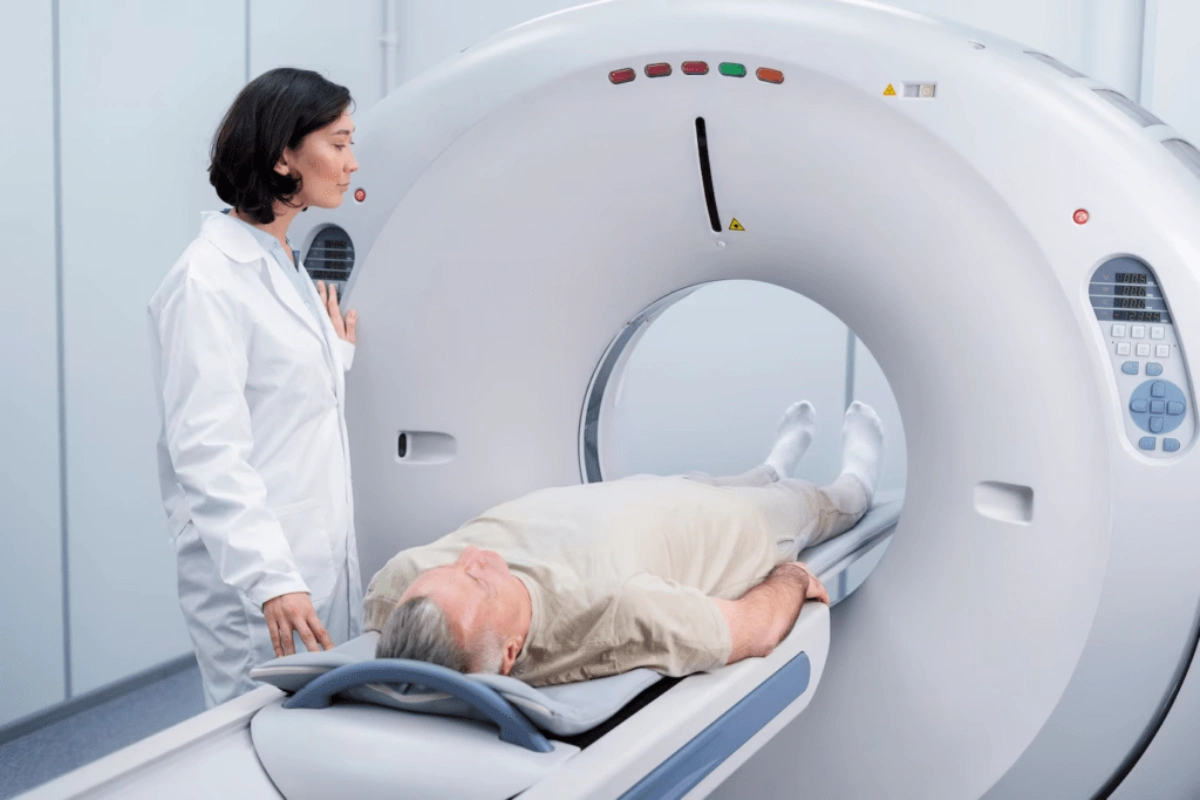
Radiology technologists earn a median annual salary of 80,110(38.51/hour) according to the most recent federal wage data, with pay ranging from roughly $55,980 for new technologists to over $118,660 for experienced specialists. This guide covers every major factor that determines your actual paycheck as a radiologic technologist — state, imaging modality, experience, employer type, and travel contracts — using verified government and industry wage data rather than estimates.
National Salary Snapshot
Radiologic technologists and technicians are tracked as a distinct occupational category by the Bureau of Labor Statistics. The most recent wage release puts the national median radiology tech salary at $80,110 per year, up modestly from the $77,660 figure reported the prior year — a normal annual adjustment as wage surveys are refreshed.
Percentile wages tell you far more than the median alone, because they show the realistic range from entry-level to top-tier pay:
| Percentile | Annual Salary | Hourly Wage | Weekly Pay | Monthly Pay |
| 10th (entry-level) | $55,980 | $26.91 | $1,077 | $4,665 |
| 25th | $64,810 | $31.16 | $1,246 | $5,401 |
| 50th (median) | $80,110 | $38.51 | $1,541 | $6,676 |
| 75th | $98,750 | $47.48 | $1,899 | $8,229 |
| 90th (top earners) | $118,660 | $57.05 | $2,282 | $9,888 |
A technologist at the 10th percentile earns roughly half of what a 90th-percentile technologist earns — a $62,680 annual spread driven almost entirely by location, modality specialization, and years of experience, each covered below.
Why Radiology Tech Salary Figures Differ Across Sources
You’ll notice different radiology tech salary numbers depending on where you look, and there’s a real reason for that beyond inconsistent reporting.
Government wage surveys measure base wages only — regular hourly or salaried pay, excluding bonuses, overtime, and shift differentials. Industry wage surveys, by contrast, typically measure self-reported total compensation, which is why those figures often run higher than government medians for a comparable population. Neither number is wrong; they’re measuring different things.
On top of base pay, most technologists have access to additional compensation types that don’t show up in headline salary figures:
- Shift differentials — extra hourly pay for evening or night shifts, commonly 8–12% above base for evenings and 15–22% for nights, though some high-demand markets pay 25% or more.
- On-call pay — a flat stipend or reduced hourly rate for being available outside scheduled hours, plus full pay once called in.
- Overtime — time-and-a-half for hours beyond 40 per week under federal wage law, which can meaningfully boost annual earnings in short-staffed departments.
- Sign-on and retention bonuses — increasingly common for CT- and MRI-certified technologists at hospitals facing staffing shortages.
- Travel stipends — non-taxable housing and meal allowances specific to travel contract positions, covered later in this guide.
When comparing a job offer against national averages, confirm whether the advertised figure is base pay only or includes differentials and bonuses. The gap between the two can exceed $10,000 a year for technologists working nights and weekends.
- Read more: Radiology Tech Salary
Radiology Technician Salary by State
Location remains the single largest driver of pay variation for this role. The table below covers all 50 states plus Washington, D.C., along with a cost-of-living-adjusted figure that reflects real purchasing power rather than raw dollars.
| State | Median Salary | Bottom 10% | Top 10% | COL-Adjusted Median |
| California | $121,260 | $70,210 | $165,460 | $109,520 |
| Massachusetts | $103,620 | $75,350 | $131,940 | $97,979 |
| District of Columbia | $102,770 | $59,130 | $128,120 | $93,511 |
| Oregon | $102,290 | $70,760 | $124,810 | $98,964 |
| Washington | $102,090 | $66,570 | $132,060 | $95,400 |
| Hawaii | $101,700 | $39,150 | $115,440 | $92,496 |
| Alaska | $98,920 | $74,210 | $126,860 | $96,640 |
| New York | $98,470 | $67,540 | $129,310 | $91,243 |
| New Jersey | $95,000 | $71,770 | $118,410 | $87,312 |
| Vermont | $94,540 | $66,960 | $125,230 | $96,511 |
| Connecticut | $91,970 | $68,070 | $122,760 | $88,766 |
| Arizona | $89,200 | $61,510 | $123,410 | $88,600 |
| Colorado | $87,760 | $63,270 | $111,730 | $85,161 |
| Maryland | $85,890 | $68,140 | $106,260 | $81,832 |
| Rhode Island | $85,330 | $65,840 | $109,640 | $83,428 |
| New Hampshire | $84,910 | $64,620 | $106,370 | $81,515 |
| Delaware | $84,210 | $61,770 | $108,980 | $84,372 |
| Minnesota | $83,400 | $67,080 | $106,100 | $84,566 |
| Nevada | $82,910 | $65,710 | $121,700 | $82,927 |
| Utah | $81,000 | $48,150 | $108,070 | $81,931 |
| Virginia | $80,670 | $60,000 | $106,170 | $79,789 |
| Idaho | $80,080 | $60,540 | $103,580 | $83,859 |
| Maine | $80,080 | $62,210 | $102,640 | $82,514 |
| New Mexico | $79,940 | $59,560 | $104,120 | $86,692 |
| Illinois | $79,930 | $59,350 | $104,210 | $79,964 |
| Wisconsin | $79,140 | $61,870 | $99,420 | $84,106 |
| Texas | $78,630 | $48,550 | $102,630 | $81,014 |
| Ohio | $78,320 | $60,360 | $98,450 | $84,420 |
| Wyoming | $77,860 | $56,750 | $104,790 | $84,000 |
| Indiana | $77,640 | $51,090 | $99,580 | $83,190 |
| Montana | $77,070 | $55,750 | $91,650 | $81,431 |
| Florida | $76,750 | $51,390 | $99,020 | $74,216 |
| Michigan | $76,420 | $55,450 | $97,250 | $79,425 |
| Kansas | $76,070 | $50,940 | $98,320 | $84,458 |
| Pennsylvania | $76,050 | $56,430 | $97,740 | $77,942 |
| Georgia | $74,550 | $49,730 | $102,840 | $77,420 |
| North Carolina | $74,450 | $52,860 | $99,210 | $78,928 |
| Oklahoma | $74,160 | $49,920 | $96,880 | $84,423 |
| West Virginia | $74,150 | $56,270 | $95,510 | $82,852 |
| Missouri | $73,080 | $50,810 | $97,150 | $80,470 |
| Nebraska | $72,860 | $54,410 | $98,300 | $80,863 |
| Kentucky | $69,670 | $51,740 | $99,170 | $77,275 |
| South Carolina | $69,600 | $51,860 | $96,020 | $74,241 |
| North Dakota | $67,790 | $60,600 | $93,870 | $76,204 |
| Iowa | $65,930 | $54,360 | $86,520 | $75,124 |
| South Dakota | $65,240 | $48,730 | $89,710 | $73,646 |
| Tennessee | $64,630 | $50,540 | $90,790 | $70,349 |
| Louisiana | $63,680 | $50,030 | $82,830 | $72,194 |
| Arkansas | $63,640 | $46,810 | $94,180 | $73,202 |
| Alabama | $60,700 | $41,060 | $80,300 | $68,338 |
| Mississippi | $59,300 | $40,740 | $78,090 | $68,198 |
The cost-of-living adjustment changes the ranking in several cases. Kansas’s raw median (76,070)trailsIllinois’s(79,930), but once adjusted for regional prices, Kansas (84,458)actuallydeliversmorerealpurchasingpowerthanIllinois(79,964). Oregon shows a similar reversal against Massachusetts: Oregon’s lower raw median ($102,290 versus 103,620)edgesaheadoncecostoflivingisfactoredin(98,964 versus $97,979). A six-figure salary in a high-cost state doesn’t automatically outperform a lower nominal salary in a moderately priced one.
Highest-paying metro areas skew heavily toward Northern California, where high demand and elevated cost of living combine: San Francisco-Oakland (131,140meanannual),SanJose-Sunnyvale-SantaClara(129,360), Santa Rosa (124,660),Stockton-Lodi(116,910), and Sacramento ($115,640) all rank among the top-paying metros nationally. By employment volume rather than pay, the largest job markets are New York-Newark-Jersey City, Los Angeles, Chicago, Dallas-Fort Worth, and Houston.
Radiology Tech Salary by Experience
Pay in this field climbs steadily with tenure, with the biggest gains concentrated in the first decade and again after a decade of specialty experience. General radiographers progress from roughly $60,600 in their first year to $71,850 at 3–10 years, $77,980 at 11–20 years, and $86,820 after 31 or more years. Technologists in advanced modalities see a steeper curve: CT technologists move from about $59,830 entry-level to $97,800 after 31+ years, while MRI technologists move from roughly $70,420 entry-level to $102,770 at 31+ years.
Position matters as much as tenure. Staff technologists across all disciplines average $81,378, senior or lead technologists average $93,518, and department supervisors or managers average $103,141 — meaning a move into a lead or supervisory role can be worth more than a decade of seniority alone.
Salary by Imaging Modality and Certification
Not every radiology tech role pays the same, and the difference usually comes down to which certifications a technologist holds beyond the base ARRT credential from the American Registry of Radiologic Technologists.
| Modality | Typical Compensation |
| Radiography (general X-ray technician) | $73,274 mean / $80,110 median |
| Computed tomography (CT) | $87,785 mean |
| MRI | $95,480 median |
| Mammography | $88,468 mean |
| Sonography | $96,590 median |
| Nuclear medicine | $97,020 median |
| Radiation therapy | 101,990–105,310 median |
Cardiac and vascular interventional technologists, radiologist assistants, and medical dosimetrists sit at the top of the imaging pay scale, often exceeding $95,000 to $136,000 in mean compensation. CT compensation grew roughly 12.3% between the two most recent survey cycles, a pace similar to general radiography, though both started from different base levels — meaning the dollar gap between specialties has widened even as growth rates converge.
Salary Progression: How to Reach $100K+
There’s a fairly well-defined path most x ray technicians follow to move from entry-level pay into six-figure territory:
- Associate degree plus ARRT certification — the entry point required for any staff position, with typical starting pay between $55,000 and $62,000.
- 1–2 years of hospital staff experience — pay moves into the 62,000–71,000 range as speed, positioning skills, and patient-handling ability improve.
- CT or MRI cross-training and certification — the single highest-leverage move available. CT technologists average 83,000–88,000 and MRI technologists average 87,000–93,000 once established, versus 72,000–78,000 for general radiography at the same tenure.
- 10+ years combined with a specialty credential — CT and MRI technologists with a decade or more of experience average 91,000–97,000.
- Lead technologist or senior specialist role — averages $93,518 across disciplines.
- Supervisor or department manager — averages $103,141, and often requires a bachelor’s degree in radiologic science or health administration.
- Corporate or applications specialist roles with equipment vendors or remote clinical support — the highest-paying track outside management, averaging $119,706.
Skipping straight from an associate degree into management isn’t realistic; most facilities require several years of clinical experience plus, for supervisory roles, a bachelor’s degree. The fastest realistic route to six figures is CT or MRI certification stacked with 8–10 years of experience, not tenure alone.
Travel Radiology Tech Salary
Travel contracts are one of the most searched aspects of radiologic technologist salary, and the numbers differ substantially from staff positions because they bundle taxable base pay with non-taxable stipends.
Current weekly pay averages across major staffing agencies cluster in a fairly tight range, generally between $1,830 and $2,292 per week. Annualized, that works out to roughly 95,000–120,000 for an average contract technologist, with top-tier assignments and interventional radiology contracts reaching 2,600–4,200+ per week (135,000–220,000 annualized) in high-demand or short-notice situations.
The pay package typically breaks down into four components:
- Taxable hourly base wage — the portion reported to tax authorities, usually lower than the total weekly figure suggests.
- Housing stipend — a non-taxable allowance, assuming a legitimate tax home elsewhere, covering short-term housing near the assignment.
- Meals and incidentals stipend — another non-taxable component based on per-diem rates for the assignment location.
- Completion bonus — sometimes paid for finishing a full 13-week contract.
Travel contracts offer higher total weekly pay, tax-advantaged stipends, exposure to different facilities and equipment, and flexibility to choose assignment locations and lengths. The trade-offs include income volatility between contracts, no guaranteed hours if a facility cancels, housing and licensing logistics across state lines, and the requirement to maintain a genuine permanent tax home to legally claim stipends as non-taxable.
Salary by Work Setting and Employer Type
Employer type changes compensation nearly as much as specialty does. Not-for-profit hospital systems and government or VA hospitals tend to pay the most among direct-care settings, averaging 91,000–93,000 across all imaging disciplines, compared to $83,000 for for-profit hospitals, $86,000 for outpatient imaging centers, and $71,600 for physician’s offices.
Large integrated health systems and academic medical centers typically offer more structured pay scales, defined shift differentials, and stronger benefits than smaller independent practices, though exact pay varies by region and local labor market conditions. VA hospitals operate under federal pay scales, which can offer strong benefits and loan repayment programs even where base salary is comparable to civilian hospitals.
Union representation affects pay predictability as well. Where technologists are represented, contracts typically specify fixed shift differentials — commonly 1.50–3.00/hour for evenings and 2.25–5.00/hour for nights — plus defined annual raises. Non-union facilities set differentials at their own discretion, which can run higher or lower depending on local competition for staff.
Specialized clinical work also affects pay indirectly. Technologists cross-trained in fluoroscopy, DEXA (bone density) scanning, interventional radiology, or PET/CT often qualify for premium positions similar to the CT/MRI pattern, since these require additional certification and carry higher clinical responsibility. Unlike CT and MRI, these sub-specialties aren’t tracked as separate wage categories in national surveys, so pay premiums are documented mainly through individual job postings rather than aggregate data.
Radiology Tech vs. Related Imaging Careers
Career changers weighing radiology against adjacent imaging and therapy fields should compare median pay directly:
| Career | Median Annual Salary | Typical Entry Education |
| Radiologic Technologist | $80,110 | Associate degree + ARRT |
| CT Technologist | ~$87,785 (mean) | Radiography + CT certification |
| MRI Technologist | $95,480 | Radiography or direct-entry + MRI certification |
| Diagnostic Medical Sonographer | $96,590 | Associate or bachelor’s degree |
| Nuclear Medicine Technologist | $97,020 | Associate or bachelor’s degree |
| Radiation Therapist | 101,990–105,310 | Associate or bachelor’s degree |
| Surgical Technologist | $64,650 | Certificate or associate degree |
| Veterinary Technologist | $47,380 | Associate degree |
Radiation therapy and nuclear medicine post the highest medians on this list, but both require handling radioactive materials or radiation therapy equipment under stricter regulatory oversight than general radiography, plus specialized coursework beyond a standard radiography program accredited by JRCERT. Sonography stands out as a comparably paid alternative that doesn’t involve ionizing radiation at all.
Frequently Asked Questions
Can you earn six figures as a radiology tech without moving into management?
Yes. The 90th percentile for general radiologic technologists sits at $118,660, and MRI technologists, corporate applications specialists, and technologists in high-cost states like California routinely clear $100,000 in staff-level roles, especially once shift differentials and overtime are factored in.
Does an associate degree limit your long-term earning potential?
Not fundamentally. Most staff technologist positions only require an associate degree, and associate-degree radiographers average around $70,100 annually. A bachelor’s degree matters more for moving into supervisory, management, or applications specialist roles than for staff-level clinical pay.
Which certification gives the fastest return on investment?
CT certification typically offers the fastest payback, since many radiography programs already include CT coursework and clinical rotations, shortening the path to certification compared to MRI, which often requires separate structured training. MRI ultimately pays somewhat more, but CT reaches profitability sooner for most technologists.
Does overtime meaningfully increase annual income?
It can, but not by doubling pay. Overtime is paid at 1.5 times the base hourly rate, so a technologist working an extra four hours weekly at the median hourly wage would add roughly $12,000 annually before taxes — meaningful, but far short of doubling income.
Are outpatient imaging centers better than hospitals for pay and lifestyle?
Outpatient centers pay somewhat less on average than not-for-profit hospitals but generally offer more predictable daytime schedules without night, weekend, or on-call requirements. Whether that trade-off counts as “better” depends on whether income or schedule predictability matters more to you.
Which imaging modality has the fastest salary growth?
Recent tracking shows computed tomography and radiography growing at a similar pace of roughly 12.3% between survey cycles, while overall compensation across all imaging disciplines rose from a prior mean in the high $70,000s to $86,484 — a gain that has outpaced typical wage inflation over the same period.
Is a radiology tech career worth the training cost for an associate degree?
Associate degree programs cost far less than bachelor’s or master’s programs in most other allied health fields, and the resulting median salary of $80,110 compares favorably against that lower training cost, since most programs run two years at community college tuition rates rather than four-year tuition. Individual return on investment still depends heavily on program cost and local job market pay.
How much does a sign-on bonus typically add for CT- or MRI-certified technologists?
Sign-on bonuses vary widely by facility, region, and staffing urgency, ranging from a few thousand dollars to $10,000 or more at hospitals facing acute shortages in CT or MRI coverage. These bonuses aren’t tracked in national wage surveys and should be confirmed directly with individual employers rather than assumed as standard.
What’s the realistic weekly take-home difference between staff and travel radiology tech pay?
Travel contracts generally pay more per week than staff positions — averaging 1,830–2,292 versus a staff equivalent of roughly $1,541 at the national median — but travelers lose employer-paid benefits, face contract gaps between assignments, and carry the compliance burden of maintaining a legitimate tax home for stipends to remain non-taxable.
Do PACS and electronic health record skills affect pay?
Proficiency with PACS (Picture Archiving and Communication Systems) and electronic health record platforms is now a baseline hiring expectation rather than a standalone pay differentiator, since nearly all modern imaging departments run on digital systems. It matters more as a qualification for getting hired than as a direct salary lever once employed.